Hazards
Flood
Tristan Ballard
Created: Jan 1, 2023 - Updated: Nov 8, 2023
Flooding captures the likelihood of a location being directly exposed to flooding, both from precipitation-based inland flooding and from coastal flooding. Flooding is among the deadlier natural disasters and poses direct risks to human health, infrastructure, and economic activity.
Methodologies
Flood potential
Metric: Annual probability of an inland (fluvial) or coastal flood with depth greater than 0.5 meters at an asset location.
This indicator quantifies the projected flood likelihood, expressed as timeseries of annual expected probability of flooding greater than 0.5 meters at the asset level. This combines inland riverine (fluvial) floods, as well as coastal flooding induced by sea-level rise and storm surge. We derive this from a combination of WRI’s Aqueduct Flood Hazard Maps product, high-resolution elevation data, and local information on flood zones. We support 90 meter regional and asset level assessments between latitudes 17N and 50N. This 90m indicator covers the contiguous U.S., southern Europe, as well as the majority of East Asia. Outside those latitudes, the same indicator is available but at a resolution of 1km.
We first bias-correct Aqueduct flood data for both inland and coastal floods based on local information on flood zones. This flood zone information is derived from the Federal Emergency Management Agency (FEMA), the UK Environment Agency, and Spain’s Ministerio para la Transición Ecológica y el Reto Demográfico. We next derive terrain-adjusted flood depths and associated probabilities using high-resolution elevation data to enhance local exposure assessments. The terrain adjustment results in 90m downscaled flood depth projections and corresponding high-resolution probability projections.
The elevation dataset is derived from tightly calibrated satellite data from NASA that include the SRTM and ASTER sensors. Higher resolution flood projections are valuable as they provide detailed and accurate information essential for effective disaster preparedness, risk exposure assessment, financial impacts from structural damage, and business interruption.
Observed floods This indicator reflects whether flooding was observed in a given year by satellites at the location of an asset. It is derived from NASA MODIS data, for the period 2012 to present.
Known Limitations
- Satellite-derived remote sensing of floods has several well-known limitations. Floods are difficult to observe by satelite, due primarily to cloud cover, which contributes to False Negatives (reporting that there was no flooding, when in reality there was). Additionally, algorithms to detect flooding can report False Positives (detecting a flood when there was none, due to shadows and ground moisture). No historic flood database is comprehensive, even for recent years in the satelite period.
- SSP1 is currently not available from the underlying data product, and our product is using SSP2 in place of SSP1 (SSP2 is duplicated in this product).
Sample Assessment
United States Counties
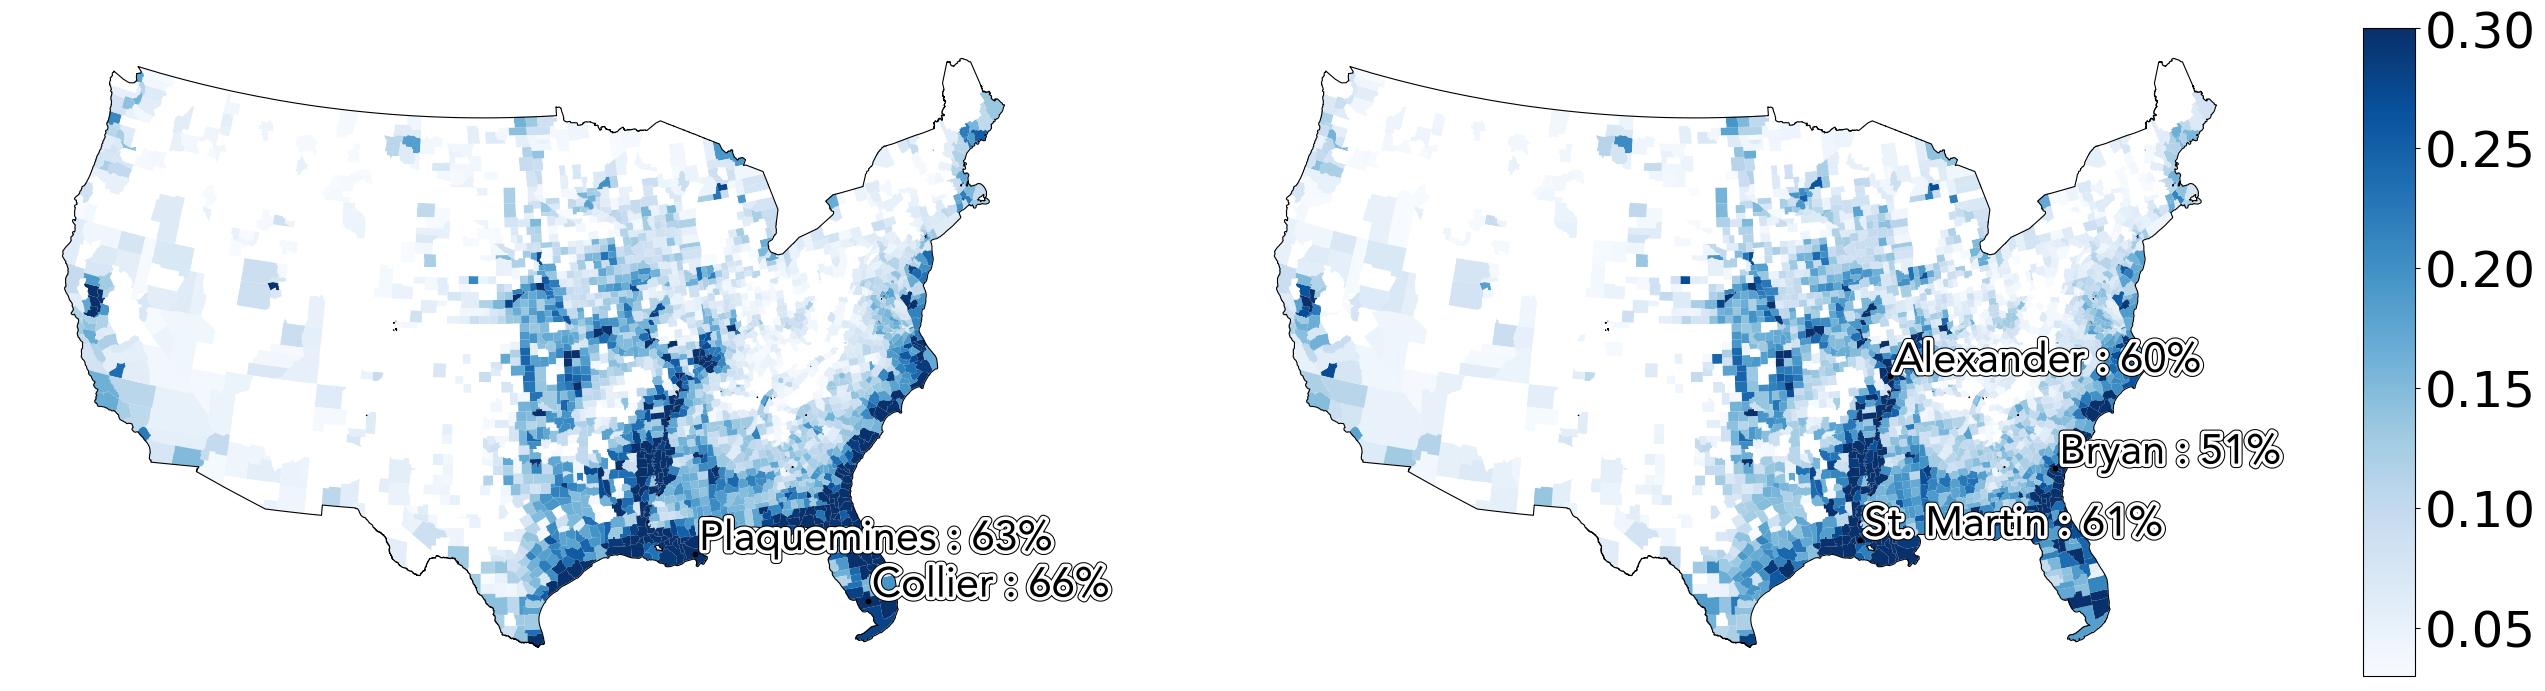
Projected mean annual flood risk exposure over 1980-2010 (left) and 2022-2052 (right) with SSP5-RCP8.5 scenario.
| US Counties with top flood exposure over 2022-2052 | ||||
|---|---|---|---|---|
| State | County Name | Score (1980-2020) | Score (2022-2052) | Percent Change |
| Panola | Mississippi | 0.0 | 0.08 | N/A |
| Garza | Texas | 0.03 | 0.07 | 141 |
| Sutter | California | 0.0 | 0.07 | N/A |
| Outagamie | Wisconsin | 0.07 | 0.07 | -1 |
| Clay | Illinois | 0.04 | 0.06 | 47 |
English Counties

Projected mean annual flood risk exposure over over 1980-2010 (left) and 2022-2052 (right) with SSP5-RCP8.5 scenario.
| England Counties with top cyclone exposure over 2022-2052 | |||
|---|---|---|---|
| Region Name | Score (1980-2020) | Score (2022-2052) | Percent Change |
| Aberdeen City | 0.12 | 0.06 | -50 |
| Bolton | 0.0 | 0.04 | 800 |
| Manchester | 0.0 | 0.03 | 800 |
| Essex | 0.0 | 0.03 | N/A |
| Manchester | 0.0 | 0.02 | N/A |