Hazards
Water Stress
Tristan Ballard
Created: Jan 1, 2023 - Updated: Aug 20, 2023
Water is a requirement for societal development and progress, and its availability plays a critical role across a wide variety of activities. This includes food security, human health, electricity generation, manufacturing and mining. Changing water availability due to climate change, coupled with increasing demand from population growth and economic activity, will have substantial impacts across the globe. Rigorous, high resolution water supply and demand data is therefore needed to enable assessment of water risk exposure, both directly and throughout supply chains. Projections of future water availability can help companies and investors prepare for the complex economic and social challenges related to water stress.
Methodologies
Unified Water Stress
Metric: Unitless water stress score, combining the Standardized Precipitation Evapotranspiration Index (SPEI) and WRI Aqueduct’s water stress scores. Higher values indicate greater water stress, with values greater than 0.6 and 0.8 generally considered to be at high and severe water stress, respectively.
This indicator combines the water stress score and the drought indicator to one single indicator for water stress, using a weighted mean, with weights derived from the methodology designed by the World Resources Institute in their Global Aqueduct Methodology (Page 35, Table 3). This provides a comparable 0.0 to 1.0 range to indicate exposure to water stress. The indicator captures both meteorological factors as well as anthropogenic factors associated with water stress.
Unified Water Stress is the recommended default indicator for future water stress risk.
Aqueduct Water Stress Score: The World Resource Institute’s Aqueduct product models future water stress risk. This state-of-the-art model has been extensively used by researchers in academia and industry to assess portfolio water risk. The water stress score is calculated as the ratio of water withdrawal to renewable water availability and is indicative of competition for local water resources.
SPEI Drought: The Standardized Precipitation Evapotranspiration Index (SPEI) is a drought index based on precipitation and temperature. Sust Global’s product derives this index from NASA’s Global Downscaled Daily Projections GDDP. SPEI represents the magnitude of precipitation deficits or surplus over the preceding 12-month period, after accounting for temperature-driven effects on evapotranspiration.
Historic Water Stress This indicator utilizes the same methodology as the unified water stress indicator, except with observed rather than modeled datasets of water stress and drought.
Known Limitations
- Unified Water Stress can be used as a measure of relative risk across assets, with values over 0.8 generally corresponding to severe water stress. In cases where an absolute metric is desired, the Aqueduct Water Stress Score indicator is recommended (see product documentation below).
- SSP1 is currently not available from the underlying data product, and our product is using SSP2 in place of SSP1 (SSP2 is duplicated in this product).
- Our modeling framework does not account for water transport between watersheds, which helps to meet demand in dry regions at the cost of transportation.
Sample Assessment
United State Counties
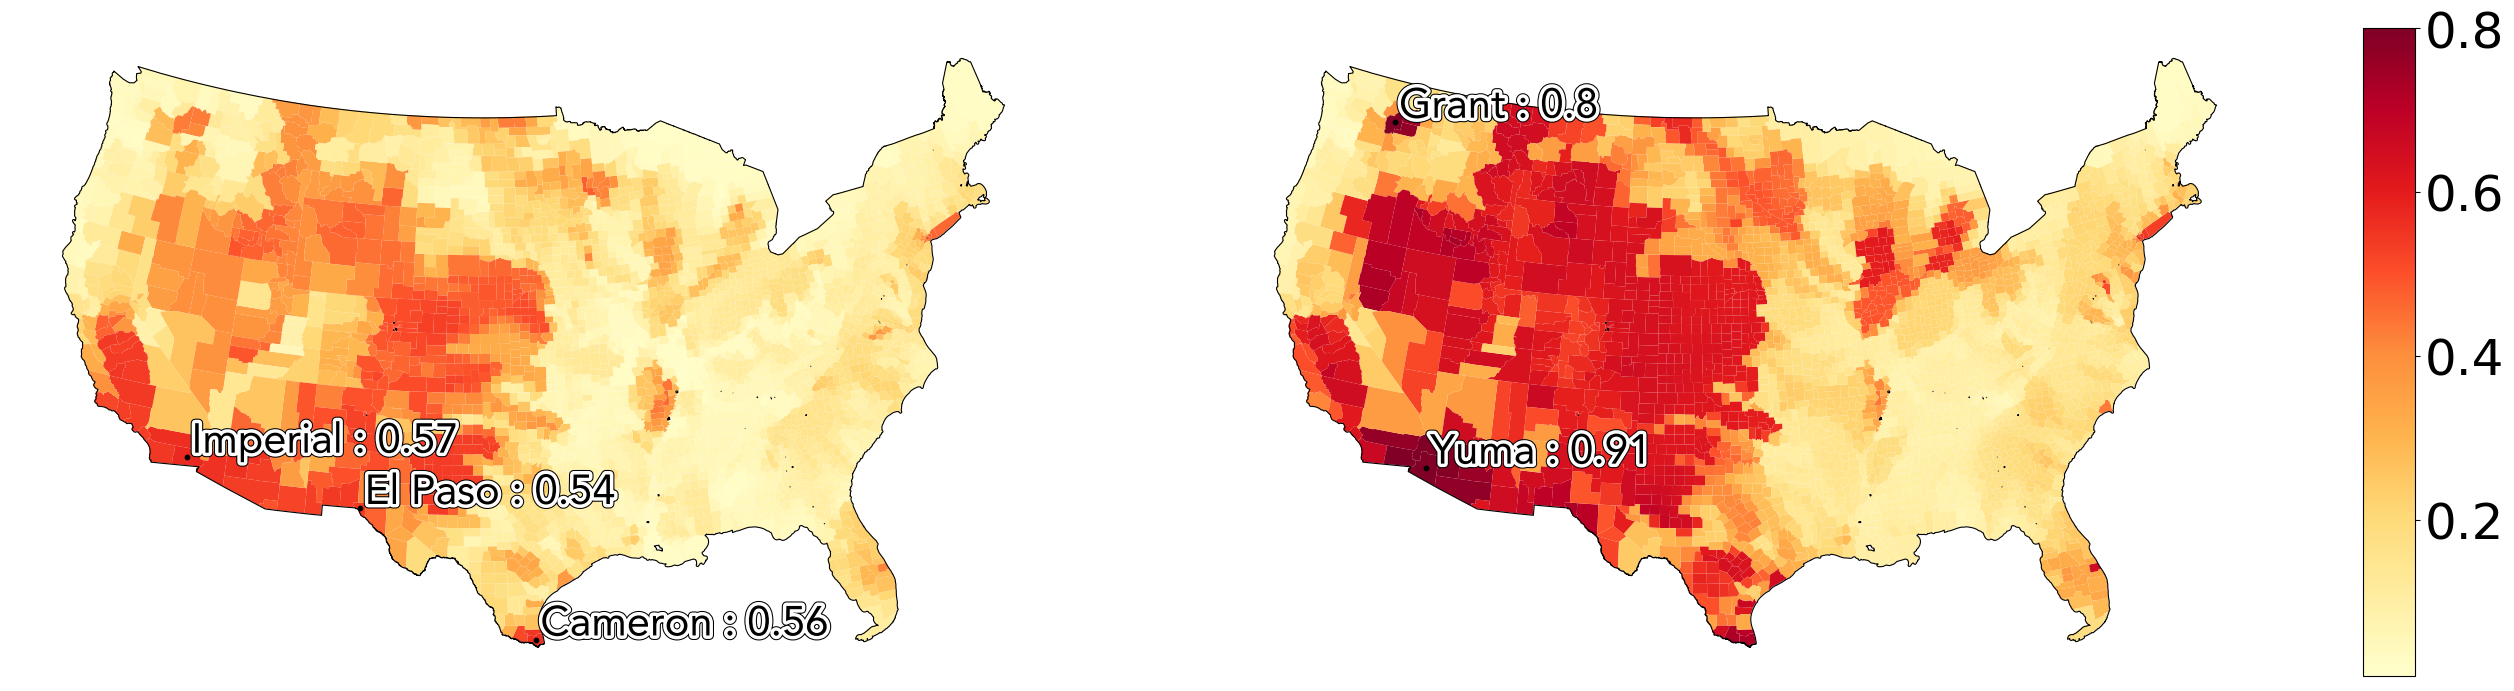
Projected mean annual water stress risk exposure over 1980-2010 (left) and 2022-2052 (right) with SSP5-RCP8.5 scenario.
| US Counties with top waterstress exposure over 2022-2052 | ||||
|---|---|---|---|---|
| State | County Name | Score (1980-2020) | Score (2022-2052) | Percent Change |
| Arizona | Yuma | 0.56 | 0.91 | 63 |
| California | Imperial | 0.57 | 0.89 | 55 |
| Arizona | La Paz | 0.37 | 0.84 | 126 |
| Washington | Grant | 0.43 | 0.81 | 86 |
| Arizona | Maricopa | 0.55 | 0.79 | 42 |
Australian Towns
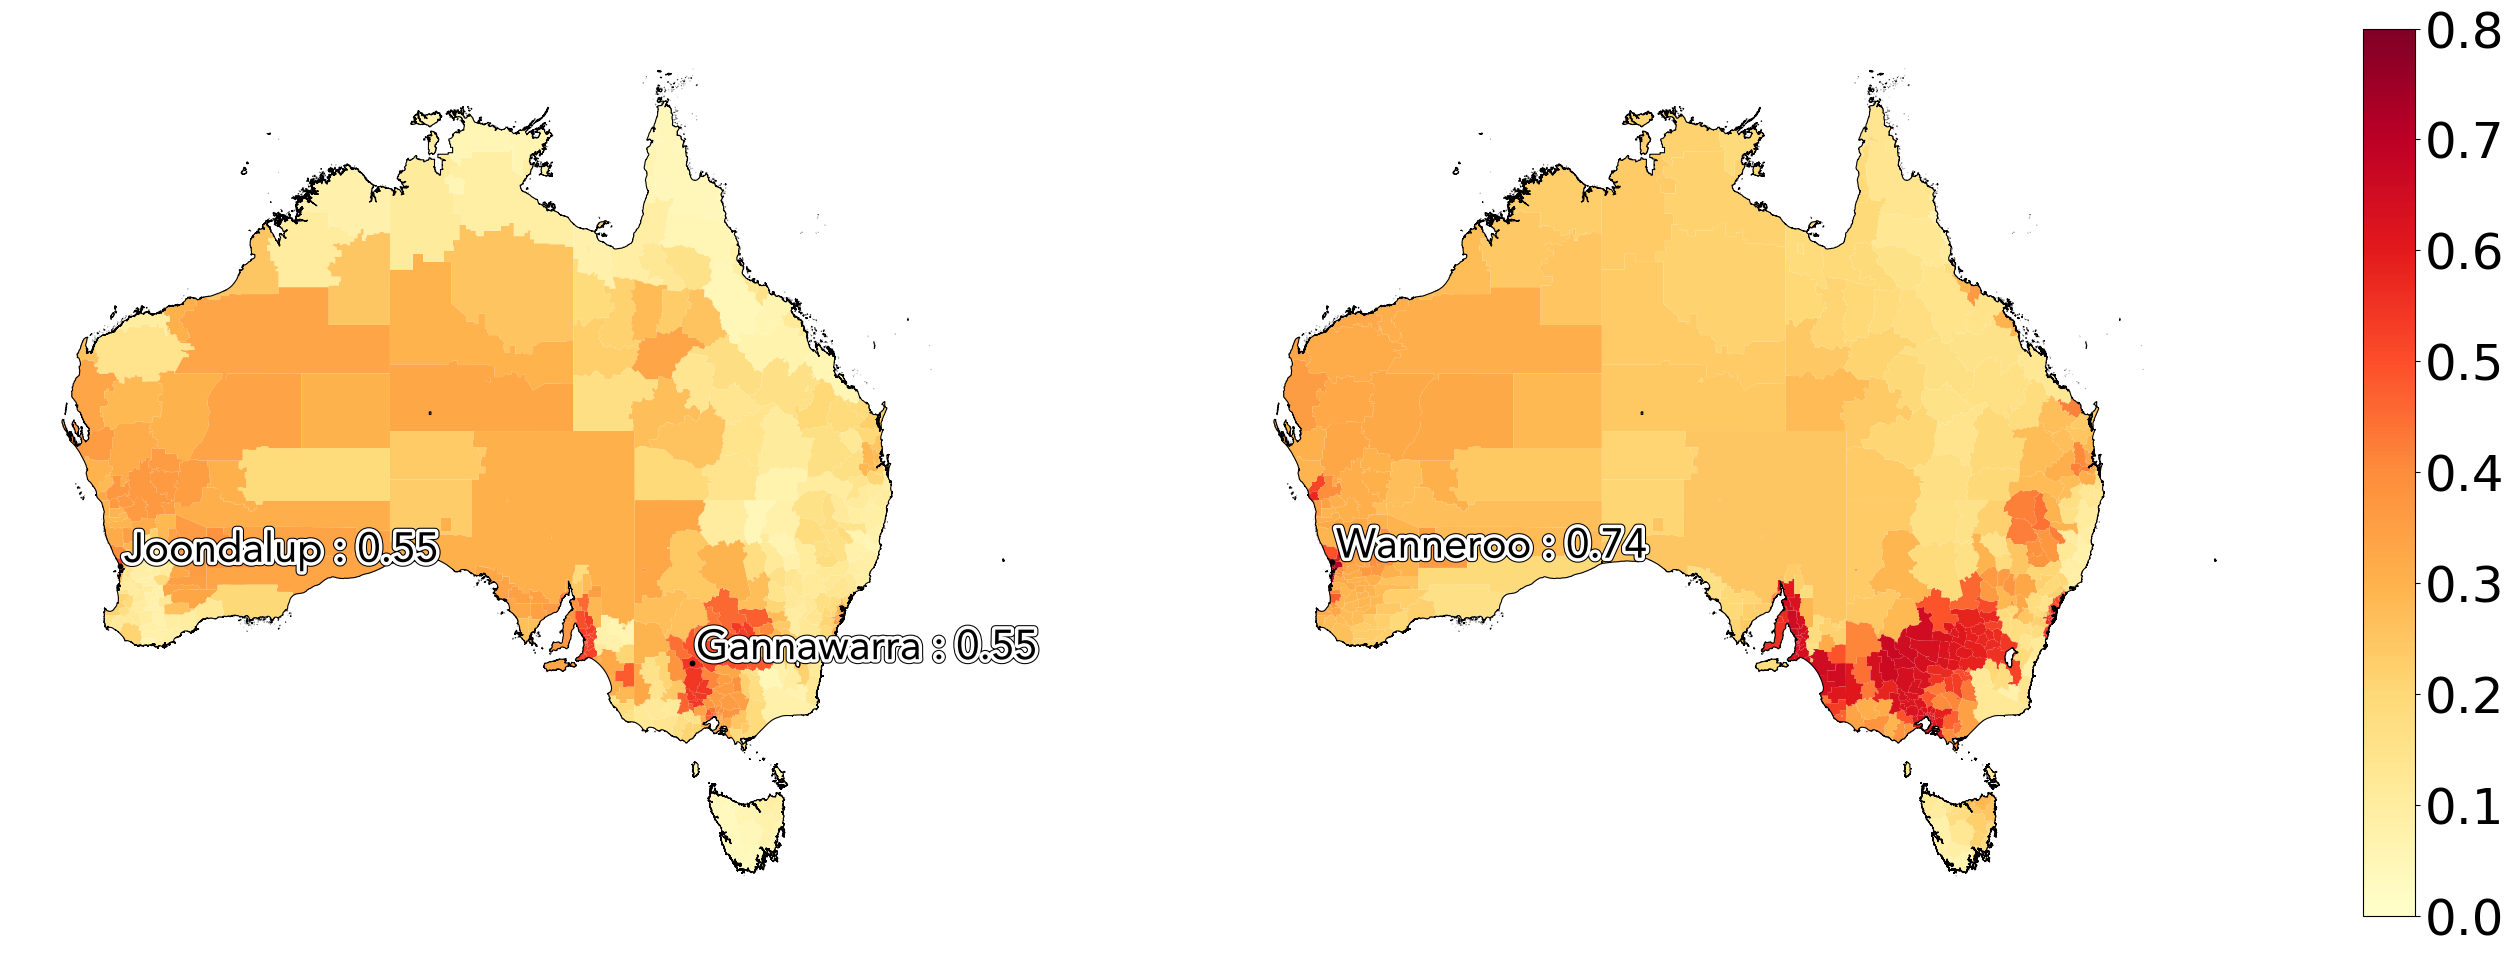
Projected mean annual water stress risk exposure over 1980-2010 (left) and 2022-2052 (right) with SSP5-RCP8.5 scenario.
| Australian Towns with top water stres risk over 2022-2052 | ||||
|---|---|---|---|---|
| State | Region Name | Score (1980-2020) | Score (2022-2052) | Percent Change |
| Western Australia | Wanneroo | 0.54 | 0.74 | 39 |
| Western Australia | Joondalup | 0.55 | 0.74 | 36 |
| Western Australia | Cockburn | 0.35 | 0.73 | 110 |
| Western Australia | Bayswater | 0.34 | 0.73 | 114 |
| Western Australia | Cambridge | 0.48 | 0.73 | 54 |
Data Sources
References
- Global Aqueduct Methodology (Page 35, Table 3)
- SPEI